Overview
In this tutorial, we'll go through a process of implementing a page populated with dynamic data using Fragments and Fragments Chrome Extension. In this post, we'll focus on a relationship between Fragments and the Chrome Extension so you should already know how to set up a project and preferably have at least basic understanding of what Fragments are (although it's not necessary).
You'll learn how to:
- integrate with 3rd party APIs
- design a data flow architecture with Fragments
- visualize and debug the flow with the Fragments Chrome Extension
This tutorial is also available as a video:
Fragments
Before explaining what the Extension can help us with, we need to recall what Fragments are. In abstract terms, they are a mechanism for describing data flow and are used primarily to compose data from various sources, e.g. integrate with third-party services (APIs), cloude cache or datatbases. We can use them to define graphs (trees), where each node acts either retrieving or processing data. Those graphs are then evaluated by Knot.x.
For example, imagine a scenario where we need to display what weather is in the user's location. We have a service that can tell us about the user's preferred format (e.g. Celsius or Fahrenheit) and another service for retrieving actual weather information based on the specified format. Fragments make this case trivial. Here's how the simplest case could look like:
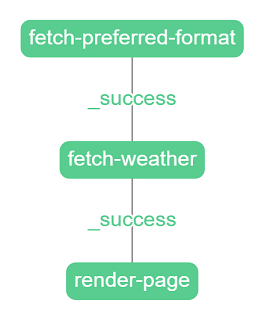
There are three nodes defined. First for fetching user's preferred format, second for fetching weather, and third for rendering the fragment. When a node is finished it chooses a state (e.g. success, represented by the color green) and then triggers the next node based on its edges. A node with a success state triggers the node defined in its _success edge.
If we want to handle errors (e.g. one of the services returns code 500) we can just define additional edges that are triggered when an action fails. All of this without writing a single line of code.
Fragments Chrome Extension
The Fragments Chrome Extension is an open-source tool for visualizing and debugging fragments. If you enable debug mode, the rendered HTML page (or JSON in case of a restful API) is injected with additional data about fragments processing, that can be read by the extension. The tool displays information about:
- the execution time of fragments and individual nodes inside them
- fragments' structure (in fact, the diagram above is a screenshot from the tool)
- data flow in the graph
- additional data for individual nodes, e.g. a response a node got from a service
The usage of the extension is explained throughout this tutorial. You can download it (TODO: link to the chrome store).
Writing a simple fragment
As already mentioned, we won't be going into details about how to set up the project. In this tutorial, we model a scenario where an incoming request triggers fetching an HTML page content from some external content repository (like CMS, e.g. AEM or Wordpress). The rendered HTML page looks like this:
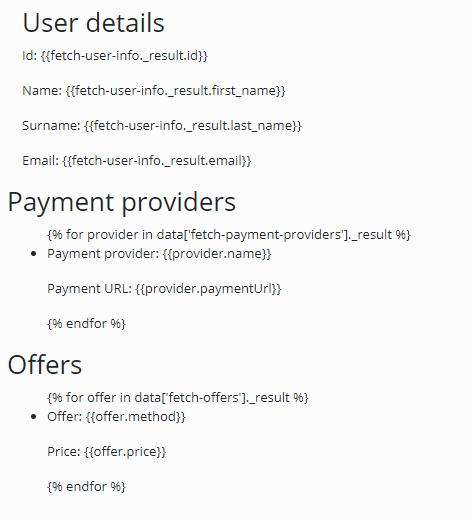
As you can see, it's not even processed right now. There is a raw templating engine markup rendered. In code, it's just a plain HTML with two Knot.x snippets inside. One of them contains markup for the User Details section, and the other for Payment Providers and Offers sections. It's worth noting that while the first snippet uses Handlebars, the second one uses Pebble templating engine. It's possible for multiple markups to exist in the same HTML file because snippets are processed independently from each other.
This is how the first snippet looks like in code:
<knotx:snippet data-knotx-task="user-task">
  <div>
    <h2>User details</h2>
    <p>Id: {{fetch-user-info._result.id}}</p>
    <p>Name: {{fetch-user-info._result.first_name}}</p>
    <p>Surname: {{fetch-user-info._result.last_name}}</p>
    <p>Email: {{fetch-user-info._result.email}}</p>
  </div>
</knotx:snippet>
The most important thing here is the data-knotx-task declaration. It provides information about what task should process this snippet. In this context "task" basically means "graph". In order for this snippet to be processed by Knot.x Fragments, we need to define a task called user-task. Detailed instructions on how to create a configuration for Fragments can be found in the Fragments Handler Documentation.
Let's start with the following task:
user-task {
  action = fetch-user-info
}
We defined user-task as an object that represents a root node of the graph. Right now, this node contains a single property action that defines what action this node is supposed to call.
In this tutorial, we are using mocks with JSON data, so fetching a user should call an appropriate endpoint via HTTP. This is the configuration for the fetch-user-info action:
fetch-user-info {
  factory = http
  config.endpointOptions {
    path = /user
    domain = webapi
    port = 8080
  }
}
The most important property to explain is the factory property. It defines which factory should produce the action (thanks to the SPI under the hood). For simplicity, think of the factory value as the type of action. In the example, we use the factory that can produce the http action - a built-in action that calls a specified address and retrieves data from it. The config.endpointOptions property should be self-explanatory. In case you're wondering why the domain is defined as webapi - this example runs as a docker swarm configured so that mocks are available at this host. If you're not using docker, it'd be localhost.
Note that we can also write and register our own factories, but it's not in the scope of this tutorial.
If we were to leave the configuration like this we would only fetch data without actually returning anything. We want to render a page though, so we need another node in our task. When the first node succeeds (so user data is fetched), we want to call a node that renders a fragment. This is the updated code for the user-task:
user-task {
  action = fetch-user-info
  on._success {
    action = te-hbs
  }
}
The on object contains all transitions (graph edges) we want to be able to handle. The format looks like this:
on {
  transition1 { node1 }
  transition2 = node2
  // ...
}
In this case we define that after a node with action fetch-user-info Knot.x should call a node with action te-hbs. This action will render the fragment using handlebars. This is how it looks like:
te-hbs {
  factory = knot
  config.address = knotx.knot.te.handlebars
}
Perhaps not what you were expecting. The knot factory allows for registering actions on the Vert.x Event Bus, thus providing more scalability. Knot actions delegate the processing to whatever is defined at the address. With that, we can fully utilise CPU resources (horizontal scaling) or use cluster mode to deploy modules vertically (on different machines) not affecting the graph simplicity.
Here's how the actual handlebars configuration looks like:
modules {
  hbsTemplateEngine = "io.knotx.te.core.TemplateEngineKnot"
}

config.hbsTemplateEngine.options {
  instances = 4

  config {
    address = knotx.knot.te.handlebars

    engine {
      factory = handlebars

      config = {
        cacheSize = 1000
      }
    }
  }
}
The entire configuration for the first snippet:
// tasks.conf
user-task {
action = fetch-user-info
on._success {
action = te-hbs
}
}
// actions.conf
fetch-user-info {
factory = http
config.endpointOptions {
path = /user
host = webapi
port = 8080
}
}
te-hbs {
factory = knot
config.address = knotx.knot.te.handlebars
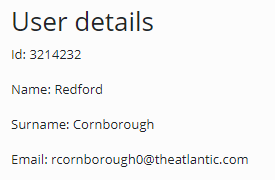
}Now the User Details section of the first snippet should render like this:
Here's when the chrome extension comes in. If we have Fragment HTML Body Writer configured adequately, the extension can read data about fragments from the HTML page. Assuming the extension is installed, let's open the inspector and go to the "Knot.x" tab. We can see a list of fragments on the page:
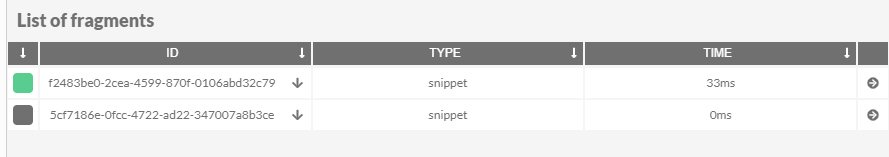
There are two fragments because we have two Knot.x snippets in HTML. We haven't defined a task for the second one thus it displays a grey square next to it. It means it wasn't processed. Ignore it for now and focus on the first one. It's green so it ended with success. There's also a randomly generated ID, a type (in this tutorial we define every fragment as "snippet"), and the time it took to process the fragment. If we click on the arrow pointing down next to the ID, we should see a list of top-level HTML elements in the snippet. In this case, it's just one div. Hover over it to highlight the div on the page.
Fragment details is the most interesting and useful part of the extension. Click on the fragment on the list to view its details. It should look like this:
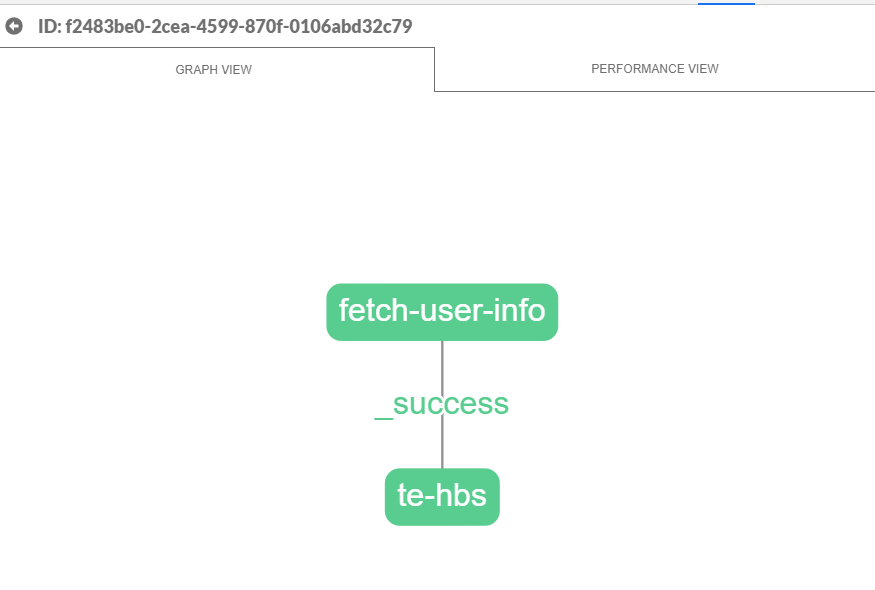
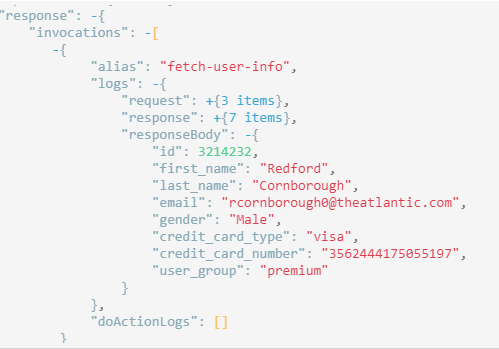
We can drag and zoom using our mouse. The structure of the displayed graph matches the structure we defined in the user-task task. Click on the fetch-user-info node to see the details of its execution. We can, for example, see what request it sent and exactly what response it got in the response property. We can also view node's configuration in the operation property.
This snippet was simple so let's move on to something more advanced.
Writing A More Complex Fragment
Now it's time to handle the second snippet. This is how it looks like in the HTML:
<knotx:snippet data-knotx-task="payments-task">
  <div>
    <h2>Payment providers</h2>
    <ul>
      {% for provider in data['fetch-payment-providers']._result %}
      <li>
        <p>Payment provider: {{provider.name}}</p>
        <p>Payment URL: {{provider.paymentUrl}}</p>
      </li>
      {% endfor %}
    </ul>

    <h2>Offers</h2>
    <ul>
      {% for offer in data['fetch-offers']._result %}
      <li>
        <p>Offer: {{offer.method}}</p>
        <p>Price: {{offer.price}}</p>
      </li>
      {% endfor %}
    </ul>
  </div>
</knotx:snippet>
It contains two sections: Payment Providers and Offers. For the sake of this tutorial, we assume that we retrieve payment information from one service and offers from another. We also assume that both of those sections are user-specific, so we'll need to fetch information about the user too.
Property data-knotx-task is defined as payments-task so this snippet will be processed by a task with that name. The most straightforward (although far from ideal) configuration for this task would look like this:
payments-task {
  action = fetch-user-info

  on._success {
    action = fetch-payment-providers

    on._success {
      action = fetch-offers

      on._success {
        action = te-pebble
      }
    }
  }
}
We defined four nodes that execute sequentially one after another. The first one reuses an already defined action called fetch-user-info. There are also fetch-payment-providers and fetch-offers actions that we haven't defined yet. Finally, in the end, there is a node with te-pebble action. This snippet uses Pebble templating engine so we have to define a new action for rendering it. If it used handlebars we could reuse our te-hbs action.
New actions we have to define are very similar to what we already have. Both fetching actions have http factory that calls mocks and te-pebble is referencing a knot defined on the event bus. In practice HOCON (the language we are writing the configuration in) allows us to use variables and other means of avoiding copy and paste. For this tutorial, we'll keep it simple though. This is the needed configuration:
fetch-payment-providers {
factory = http
config.endpointOptions {
path = /payments
domain = webapi
port = 8080
}
}
fetch-offers {
factory = http
config.endpointOptions {
path = /offers
domain = webapi
port = 8080
}
}
te-pebble {
factory = knot
config.address = knotx.knot.te.pebble
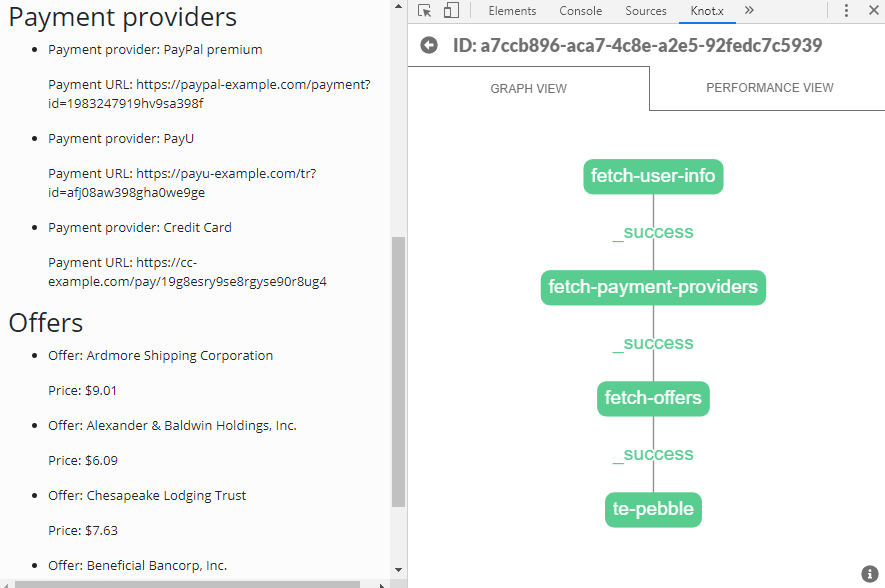
}Nothing we haven't seen already. When we load the page now we should see that the second snippet is filled with data. In the Knot.x extension we still see two fragments but this time they both have green boxes next to them - both were processed and ended with success. Click the second fragment on the list to view its details:
It works, but it's not the best approach. Right now the fetch-offers node waits for the fetch-payment-providers to succeed. There is no reason for that (remember, we assumed that those pieces of information can be retrieved independently). There would also be a problem if fetch-payment-providers failed for some reason. Then fetch-offers would not execute, even if it would be able to retrieve data and show them to the user. It'd be more efficient and safer if those two nodes could execute in parallel.
There are two types of nodes. Everything we've seen up to this point was so-called "single nodes". They just execute an action. The second type is a composite node. This kind of node contains an array of other root nodes (in fact, those are subgraphs). It executes them in parallel and waits for all of them to complete. If all of them succeed then the composite succeeds. Otherwise, the composite fails. This is how we can reorder our nodes to make use of a composite:
payments-task {
  action = fetch-user-info

  on._success {
    actions = [
      {
        action = fetch-payment-providers
      },
      {
        action = fetch-offers
      }
    ]

    on._success {
      action = te-pebble
    }
  }
}
After fetch-user-info succeeds the composite is started to be processed. It calls fetch-payment-providers and fetch-offers in parallel. When both of them succeeds the pebble node starts to be processed. We don't need to change any actions, because we've only modified the structure of the graph and not what we do with data.
When we load the page now nothing seems to have changed. However, when we open the chrome extension we can see that the second fragment looks like this:
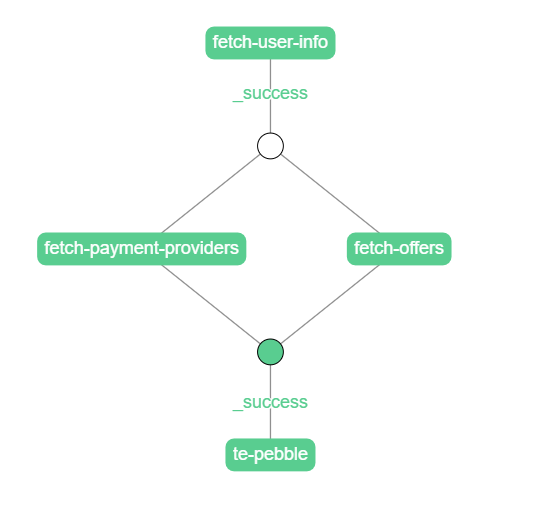
The white circle represents the beginning of a composite. The second circle is where the composite ended. All subtasks (nodes in the composite) ended with success thus the composite did too. That's why the second circle is green.
This is a good moment to introduce the performance tab. When we open the tab called "Performance View" we'll see a timeline of node execution:
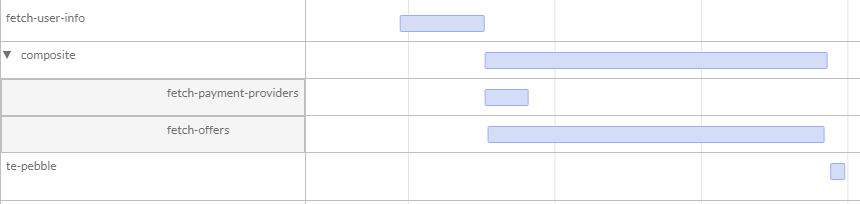
By looking at this it's clear that fetch-payment-providers and fetch-offers executed simultaneously and that the next node (te-pebble) executed only after both of them finished.
This is far better from what we had before. There is still room for improvement though. Right now we don't handle any errors. In a real application errors are unavoidable. Let's say that the service that we call to retrieve offers has a long response time. We can simulate it by using a mock /timeout. It responds with the same data as /offers but it takes three seconds to do so. Swap the endpoint in the fetch-offers action:
fetch-offers {
  factory = http
  config.endpointOptions {
    path = /timeout
    domain = webapi
    port = 8080
  }
}
When we load the page now it should take about three seconds. If we open the Knot.x extension we can immediately spot on the fragment list that the second fragment executed for a long time. When we open the fragments performance view we can see that the problem lays in the composite and specifically in the fetch-offers node.
What if such a long time is unacceptable? One approach would be to define a timeout in the fetch-offers action. However, we can do better. Knot.x provides us with a built-in implementation of a Circuit Breaker Pattern. It does so by a Circuit Breaker Factory that acts as a wrapper. Let's see how it can be configured:
fetch-offers-cb {
  factory = cb
  doAction = fetch-offers

  config.circuitBreakerOptions {
    maxFailures = 3
    timeout = 500
    resetTimeout = 20000
  }
}
The circuit breaker calls the fetch-offers action inside of itself (doAction property). If the action failed then the circuit breaker assumes something is wrong and won't actually call the action next time it's invoked. It'll just assume failure instead.
We defined the following properties:
maxFailures- number of failures it takes for circuit breaker to assume the action is not workingtimeout- the circuit breaker will assume failure after this timeresetTimeout- how long the circuit breaker should wait until it'll allow the action to execute again
Now we need to adjust the task. This is how it should look like now:
payments-task {
  action = fetch-user-info

  on._success {
    actions = [
      {
        action = fetch-payment-providers
      },
      {
        action = fetch-offers-cb
      }
    ]

    on {
      _success {
        action = te-pebble
      }
      _error {
        action = te-pebble
      }
    }
  }
}
First, we call fetch-offers-cb instead of fetch-offers in the composite. That's because the fetch-offers action will be called inside of fetch-offers-cb. Also, since we expect the task to fail, the composite should handle the _error transition. It will be called if any subtask ends with anything different than success. In this case, we still want to render the page so we call the te-pebble action.
When we reload the page we can see that the Offers section is empty. However, the Payment Providers section should still be filled with data. The tool will show this graph:
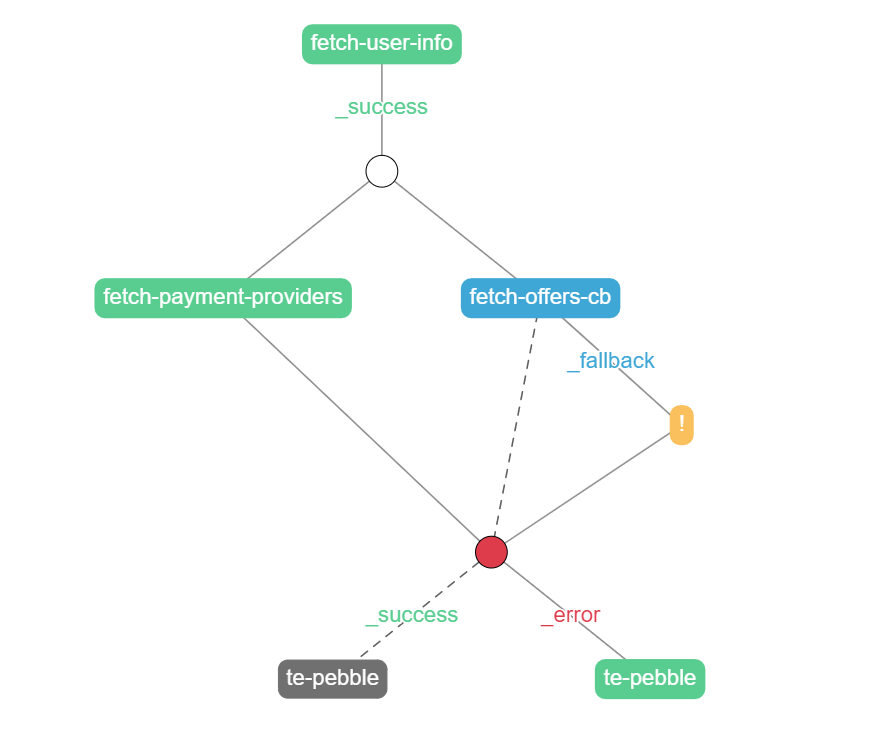
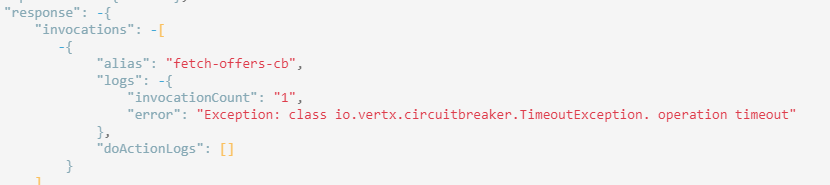
There's a lot of going on here. The fetch-offers-cb node is blue. That's because it returned a _fallback transition. It's a custom transition. Transitions are nothing more than strings. _success and _error are standard and they display respectively as green and red. Anything else is a custom transition and is displayed as blue. If we click on the fetch-offers-cb node we can see why it returned fallback: Exception: operation timeout.
The yellow node with an exclamation mark is a so-called "missing node". It doesn't exist during processing. It's just displayed in the tool as a way to catch the developer's attention. It means that a transition was triggered (in this case _fallback) but there was no node to handle it. Because of that, the _fallback state was returned to the composite and thus the composite ended with an error (composites can only end with _success or _error).
Also, note the dashed transitions. They represent a transition that could potentially be triggered, but in this case wasn't.
Finally, let's implement a node to handle the fallback case. The task should now look like this:
payments-task {
  action = fetch-user-info

  onTransitions._success {
    actions = [
      {
        action = fetch-payment-providers
      },
      {
        action = fetch-offers-cb

        on._fallback {
          action = fetch-offers-fallback
        }
      }
    ]

    onTransitions {
      _success {
        action = te-pebble
      }
      _error {
        action = te-pebble
      }
    }
  }
}
We've added an action called fetch-offers-fallback that will be triggered when the circuit breaker returns a _fallback transition. This is a transition for the composite's subtask and not for the composite.
The fetch-offers-fallback action could retrieve data from cache or another service. In our case it'll just call the /offers endpoint:
fetch-offers-fallback {
  factory = http
  config.endpointOptions {
    path = /offers
    domain = webapi
    port = 8080
  }
}
When we refresh the page we still won't see any offers displayed on the page. We'll get to this in a minute. The graph should look like this:
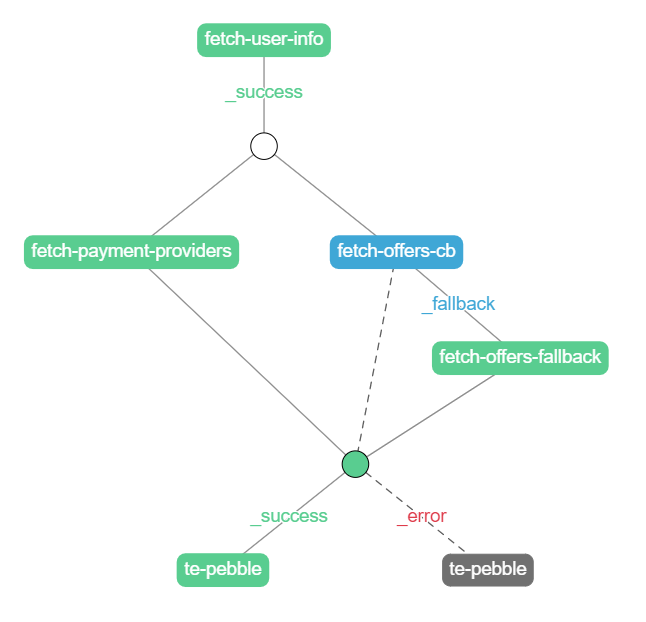
As we can see, even though the circuit breaker ended with fallback, the composite as a whole ended with success because of the fetch-offers-fallback node.
The only problem left is that we can't see any offers displayed, even though they were retrieved (we can check they were by viewing details of the fallback node). Let's take a look at the HTML snippet:
<knotx:snippet data-knotx-task="payments-task">
  <div>
    <h2>Payment providers</h2>
    <ul>
      {% for provider in data['fetch-payment-providers']._result %}
      <li>
        <p>Payment provider: {{provider.name}}</p>
        <p>Payment URL: {{provider.paymentUrl}}</p>
      </li>
      {% endfor %}
    </ul>

    <h2>Offers</h2>
    <ul>
      {% for offer in data['fetch-offers']._result %}
      <li>
        <p>Offer: {{offer.method}}</p>
        <p>Price: {{offer.price}}</p>
      </li>
      {% endfor %}
    </ul>
  </div>
</knotx:snippet>
Pebble retrieves offers data from a key called fetch-offers. By default, every action saves data under its name. The problem is that in case of a timeout the action that retrieves data is called fetch-offers-fallback and therefore that's where the data is stored. One way to resolve this would be to use an action that rewrites data from one key to another. For the sake of this tutorial, we'll just create additional markup for fallback messages. The Offers section of the snippet will look like this:
<h2>Offers</h2>
<ul>
  {% for offer in data['fetch-offers']._result %}
  <li>
    <p>Offer: {{offer.method}}</p>
    <p>Price: {{offer.price}}</p>
  </li>
  {% endfor %}
  {% for offer in data['fetch-offers-fallback']._result %}
  <li>
    <p>Fallback offer: {{offer.method}}</p>
    <p>Fallback price: {{offer.price}}</p>
  </li>
  {% endfor %}
</ul>
If we render the page now, we'll be able to see the fallback offers:

Summary
As you can see Knot.x Fragments allows us to easily define data flow when integrating with 3rd party services. In this example, we rendered a page, but note this mechanism can be used to build restful APIs as well. The Knot.x extension can be used during many processes of building an application. It can be used by developers for debugging purposes, new team members to familiarize themselves with the application's architecture, quality assurance/testers to detect flaws and identify root causes of bugs (is it a frontend, backend or integration problem?) or architects and business people to visualize the data flow and business cases.
The code used in this example can be found in our samples repository.
If you are interested in more use cases for the Knot.x Chrome Plugin, please read this article.